


Vasanth
Nov 29th, 2018
Trading Futures with the MMI
How you can use the Market Mood Index to build a trading strategy.
The most frequent question asked by investors is when to buy or sell. Warren Buffett famously answered this question when he said:
“Be fearful when others are greedy and greedy when others are fearful”
The Market Mood Index (MMI) helps investors measure these emotions of fear and greed through a quantitative scale.
MMI describes the current mood of the market on a scale of 0 to 100. You can understand more about the index here.
Retail investors shouldn’t be bothered about the exact value of the MMI and should rather look at the zones — buy in high extreme fear (values below 20) and sell in high extreme greed (values above 80).
MMI can also be useful for Traders using Nifty futures and options. I’m presenting a very simple strategy based on Nifty futures and MMI in this post.
Strategy
- Long Nifty futures when MMI goes below 15 and short Nifty futures when it goes above 85
- Keep a profit target of 1% on both long/short legs and a stop loss of 2%
- Close the position when you either hit the profit target or stop loss
- For the days when position is not open, invest your money in liquid instruments
Results
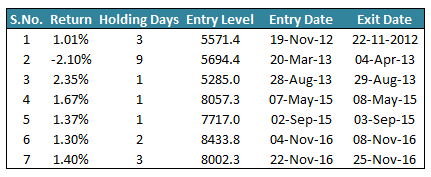
The table below represents the trade details of long leg (enter when there is fear — MMI<15).
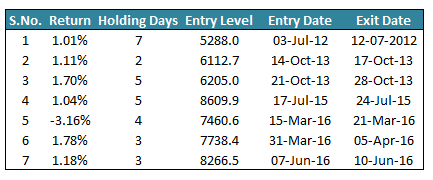
All calculations are done based on EOD values of MMI and Nifty. Below table highlights the trade details for short leg (go short when there is greed — MMI>85).
Results of both long and short legs are combined in the below table.
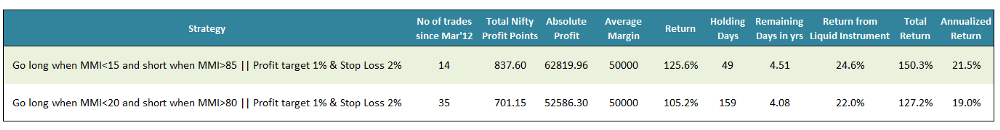
The first row of the table, highlighted in green, contains the results of the above strategy. We did the backtest beginning Mar’12. First column shows that we got 14 such instances when MMI was above 85 or below 15 — the sum of all the instances in both fear and greed tables shown above. Second column shows the total net Nifty points that were covered in these 14 instances. For example, the first instance of fear table shows that Nifty return was 1.01% with an entry level of 5571.4. This means that total Nifty points covered in the trade was 5571.4*1.01%=56.35. The value of 837.6 shows that a net total of 837.6 nifty points were covered in the 14 instances. For every Nifty point, a user makes Rs 75 on the Nifty future. Thus, a total of 837.6 translates into a profit of Rs 62819.96, as shown in the third column.
On an average, we can assume the margin for Nifty future contract to be Rs 50,000, thus it translates to a return of 125.6% (62,819.96/50,000). Total holding days of the strategy i.e. the sum of the 3rd column for both fear and greed tables is 49. The strategy says to invest in a liquid instrument for the remaining days. Assuming that the liquid instrument would have given 5% return, we get an extra return of 24.6% in remaining 4.51 years. Total return in the summary table is simple summation of future return and liquid instrument return. The second row highlights the results for the same strategy, but with MMI trigger levels of 80 & 20, instead of 85 and 15.
This strategy is not a trade recommendation and just highlights one of the many ways in which the MMI can be used. As explained earlier, investors investing in stocks shouldn’t look at the exact MMI values, but should look at the zones.
MMI is not a trade recommendation tool and is only designed to help investors better time the market, once they have decided to invest.
*some small assumptions like buying and selling at EOD and directly adding liquid and future returns were made, for easy to understand calculations.
Related Posts
Add a comment